12 April 2020 (Brussels, Belgium) – This post was started last December during the “Pre-Coronavirus Epoch” (many of you may remember that period) and was originally titled “The divinity of data, and the flimsy fabric of computation”. Its genesis was a Linkedin comment by Peter Stannack:
“Technology blinds us with fairy dust. Technology will, metaphorically speaking, change at midnight, leaving us dressed in rags and missing a shoe. Technology is being built with data by people who are much more intelligent than me, but none have my best interests at heart.”
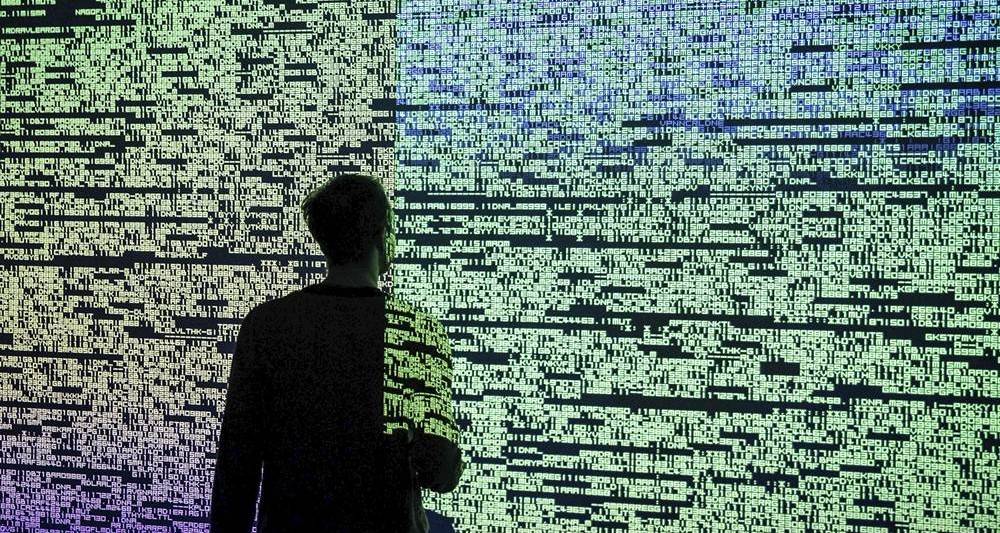
It started a flurry of Linkedin exchanges and off-line exchanges among myself, Peter, Dr. Chris Donegan, Nicolas Granatino, Rui Vale, plus a host of others over data: the rapidity and scale of this digital data inversion, its “hockey stick” profluence, and the implications for how we understand and live in the world. How data … the good, the bad, the ugly … floods our planet oceanically, with consequences – for data science, data storage, data networks, processing technologies, artificial intelligence, social media, smartphones, robotics, automation, the Internet of things, autonomous vehicles and weapons, and the surveillance state. It is something that no one could have imagined two decades ago.
We talked about the colonization of our minds by our technology, illuminating major milestone moments in that techno-rapture. And, of course, our stupidity and naivety in dealing with it. Peter reminded me of a scene in the Woody Allen movie Annie Hall. In it, Allen tells a joke:
“Two elderly women are at a Catskill Mountain resort, and one of them says, ‘Boy, the food at this place is really terrible.” The other one says, “Yeah, I know, and such small portions, too’. “
Peter’s point was simple. This seems to be how data scientists feel, too. They want much more data. Even if it is bad data. Because data will (eventually) solve all problems. WOW! Nearly every profession and discipline has become data-dependent, if not data-overwhelmed, each now vying to become its own avatar for a “thin-slicing” paradigm (itself inverting Malcolm Gladwell’s conventional “blink” conception of thin-slicing) that sucks unfathomable quantities of data and layered information about our material world (pretty much anything that can be measured, with much of it also imaged) into its maw. The micronic scale of subatomic particles and the eternally vast spaces of the universe are beyond our capacity to process. Similarly, data volumes – terabytes, petabytes, exabytes, zettabytes and beyond – have scaled beyond our capacity to process as individuals. This is not to say all data analysis is bad, that there has been no good, beneficial data analysis. I will get to that later in this post.
Last week a series of Linkedin posts and exchanges by Susan Brown and Dave Dickson and their followers caused me to dust off the original post but rewrite it for the new “Coronavirus Epoch”. Because it brought home the issues of asymmetric information, incentive distortions, self-fulfilling crises, and systemic data risk. In a bit you’ll meet Susan and Dave plus all of the people I just mentioned in these opening paragraphs, with links to their profiles and/or web sites, plus a host of others.
I find myself in the enviable position … if that is the correct term … as COVID-19 rages all around me. I normally divide my time between homes in Crete and Brussels, with trips to Paris and Rome where my media teams and video crew/production facilities are based. So I have been receiving pandemic feedback from multiple sources across Europe. Add to that a lot of time to read just about everything I can and to call multiple sources so … voilà … I can consolidate a lot of information into what I hope has been a concise and helpful series of blog posts looking at this pandemic.
The coronavirus situation has been enormously well mined, but it does require a large amount of original research – almost all of it on-line although I have dug deep into my fairly extensive library, re-discovering books half remembered. And lots and lots of feedback from readers. So I am fortunate. Besides my media teams, I have access to an extensive Linkedin network (5,000+ connections) and 75+ blogs I read on (almost) a weekly basis. I have copiously consumed the fruits of the work and diligence by these authors (many of whom I have noted in past posts, and I will continue to quote in this post) with admiration, respect and gratitude. There have been hundreds of direct messages, text messages and phone chats.
There are many to thank. But a few I must place front-and-center in my pandemic research and posts because we have had long relationships on social media and/or we actually have met via the 10+ conferences and workshops I attend every year. To a certain degree, their skills sets are my skill sets but they have a deeper expertise in certain of those skill sets, and due to their patience to review and edit my work, it has allowed me to sharpen mine. And there are scores of new connections I have acquired specific to this blog series. As I go along, I will provide links to profiles or web sites so you can follow them, too :
• Ajit Maan is a security analyst, defence strategist, and a narrative specialist, based in the U.S. Her work in narrative warfare … understanding the weaponization of information, and how the commitment of liberal democratic societies to free speech and open information exchange has been turned against us by societies that don’t value or practice the same ideals themselves … is a masterclass in multi-dimensional, multidisciplinary writing. She has helped me to understand the need to “set the narrative” in my coronavirus pieces, which you’ve seen.
• Pamela Williamson, a former lawyer and Master of Conflict and Terrorism Studies, is a writer of narratives, stories, political analysis and satire, based in New Zealand. She has helped me to understand that this constitutes the greatest threat to human security since the Spanish flu a century before, forcing a fundamental rethinking of the way we live, how we relate to others, and indeed what it is to be human.
• Nicole Morgan, Ph.D, is Professor Emeritus at the Royal Military College of Canada, just the most recent stop in a rich and varied academic life spread over two continents, several cultures and subject matter specialties. Her focus on the impact of globalization on human ecology, on the ideologies as they construct and deconstruct part of our humanity, has enabled me to “round out” my look at this pandemic. Our email/message exchanges have been a revelation.
• Peter Stannack is the CEO of Prebbler Technologies (self-described “Punk AI Proponent, Machine Intelligence Integrator” but I’d also add polymath) based in the UK. We’ve discussed a torrent of subjects but of late a simple theme: as we proceed blindly and incrementally in one direction or another, collapse often takes us by surprise. We step over what’s called a “Seneca cliff”, which is named after the ancient Roman philosopher who was the first to observe the ubiquitous truth that growth is slow but ruin is rapid.
• Dr. Chris Donegan is a co-founder of Invention Capital Associates, a consultancy that helps companies realize the true value of their intangible assets. But that belies his true value (at least for me): he has kept me focused on one thing, that “the world isn’t ending, it’s just rebooting around a new paradigm.” His admonition … “Ah, not so fast …” are always well-timed. And accurate.
• Nicolas Granatino is co-founder of Cronycle, a company I have noted many times over the last few years in my blog posts. It is a brilliant collaborative research platform which lets users curate articles from Twitter and RSS feeds into Pinterest-like boards and allows teams to collaborate on projects by following curated boards. His daily COVID-19 column for Cronycle is a Master Class on how to do a “data brief”, understanding the complex exponential problem we are dealing with, and the difficult data paradigm we are dealing with. Vigilance is warranted.
• Rui Vale is a a co-founding member of the Digital Life Collective which uses digital technologies to improve our lives — for convenience, connection, information, and entertainment. A self-described “cherubinic debunker on business, work, and technology”, Rui has kept me focused on always taking an enlightened long view on all things, not just our present predicament.
• Randy B. is the owner of Security 360, an IT security consultancy based in Maryland, who has been curating a massive amount of coronavirus-related content which has been been a great assist to my research.
• Charles Christian, a writer, editor, barrister, journalist and radio host who is always writing. I am often accused of employing “TL;DR” blog posts. But I detest an environment which rewards simplicity and shortness, which punishes complexity and depth. However it was Christian who taught me “your posts can be in depth but do not need an army of phrases, moving across a wide landscape, to wrestle your ideas to the ground. You can be long but you need to be concise. And stay on point”. He does not edit all of why work (he had no hand in editing this one so all syntax, structure, content, typo errors I own) so I try to keep myself in check in every piece I write.
• Vincent Cc Cheng of the Department of Microbiology, The University of Hospital, in Hong Kong. I learned about him though my membership in IEEE Spectrum and he keyed me into Clinical Microbiology Reviews which has done deep dives into severe acute respiratory syndrome coronavirus. It was through that research I learned the long history China has dealing with this emerging and reemerging infection, probably since 2003. He has also helped me to understand that while most diseases have a multifactorial pathogenesis, the conceptualization of their causation varies by discipline.
• Tom Forth, who runs a small startup called imactivate and is also the Head of Data of ODILeeds, and lives in Birmingham, UK. More a Twitter follow, we both speak and read French so we’ve had a common interest in following the coronavirus progress in France and its use of data, as tracked via Le Monde and other French media outlets which have been a treasure trove of data.
So, yes. A tsunami of material to read. With a high level of complexity. The unprecedented uncertainty amid the coronavirus pandemic … especially the data … has decimated our carefully laid plans and unsettled our minds at equal pace. This coronavirus, with its health, social, scientific and economic impacts, has made the content production engine of this world go into overdrive, leaving most of us struggling within an infodemic. As I have noted before, we have entered an age of atomised and labyrinthine knowledge. Many of us are forced to lay claim only to competence in partial, local, limited domains. We get stuck in set affiliations, set identities, modest reason, fractal logic, and cogs in complex networks.
But we need to be careful and not use this new complexity of knowledge as an excuse for dominant stupidity. We need to understand the challenge to be taken up, prudently but with determination. We all know stuff. We all know data. More than ever, there is an urgent need for perspective, for bringing about a new coherence, and for far-sightedness, even if encyclopedic knowledge is out of reach.
Venturing onto ground where I’ve no guarantee of safety or of academic legitimacy, it’s not my intention to pass myself off as a scholar, nor as someone of dazzling erudition. It will be enough for me to act as a messenger for those who do have knowledge. No doubt the old dream that once motivated Condorcet, Diderot, or D’Alembert has become unrealizable – the dream of holding the basic intelligibility of the world in one’s hand, of putting together the fragments of the shattered mirror in which we never tire of seeking the image of our humanity. But even so, I don’t think it’s completely hopeless to attempt to create a dialogue, however imperfect or incomplete, between the various branches of knowledge effecting and affecting this pandemic.
But as I dug into this task, I realized the data was skewed. And unreliable information adds to anxiety as it ultimately leads to contradictions, doubts, and lack of trust. A number of people saw this, were saying all of this. Leslie Jackson summed it up precisely :
The statistics for every country are skewed. Some countries only test those needing medical attention while others are expected to self-quarantine … but are not included in the confirmed cases. Other countries such as Korea and Singapore were testing far more to eliminate those with symptoms similar to covid-19.
On the deaths, some countries have included all those who die from covid-19 … but not those who die of other illnesses but have the virus, while other countries like Italy are including every person who dies and is positive for covid-19.
You must be vigilant with this data. These differences will account for the diverse recovered-to-deaths ratios on closed cases and the deaths-to-total-cases. Until there is a consistent testing regimen and reporting (which is impossible, really), comparing countries is like comparing apples to pineapples.
Then, as I read the numbers in the U.S., I realized one of the challenges that has made the pandemic data so difficult to understand (much less control) was that the research increasingly suggested a large number of people infected with the virus may be showing no symptoms — as many as 25 percent, according to U.S. officials. That means that in places with limited testing, doctors and scientists knew they are missing people who are infected with the virus – who may have been spreading it to others. These figures were not in the data.
But before I get into the horror of the data … the subject of this piece … let’s follow the advice of Ajit Maan and set the narrative in a granular fashion. We’ll go 10,000 feet up, then drill down.

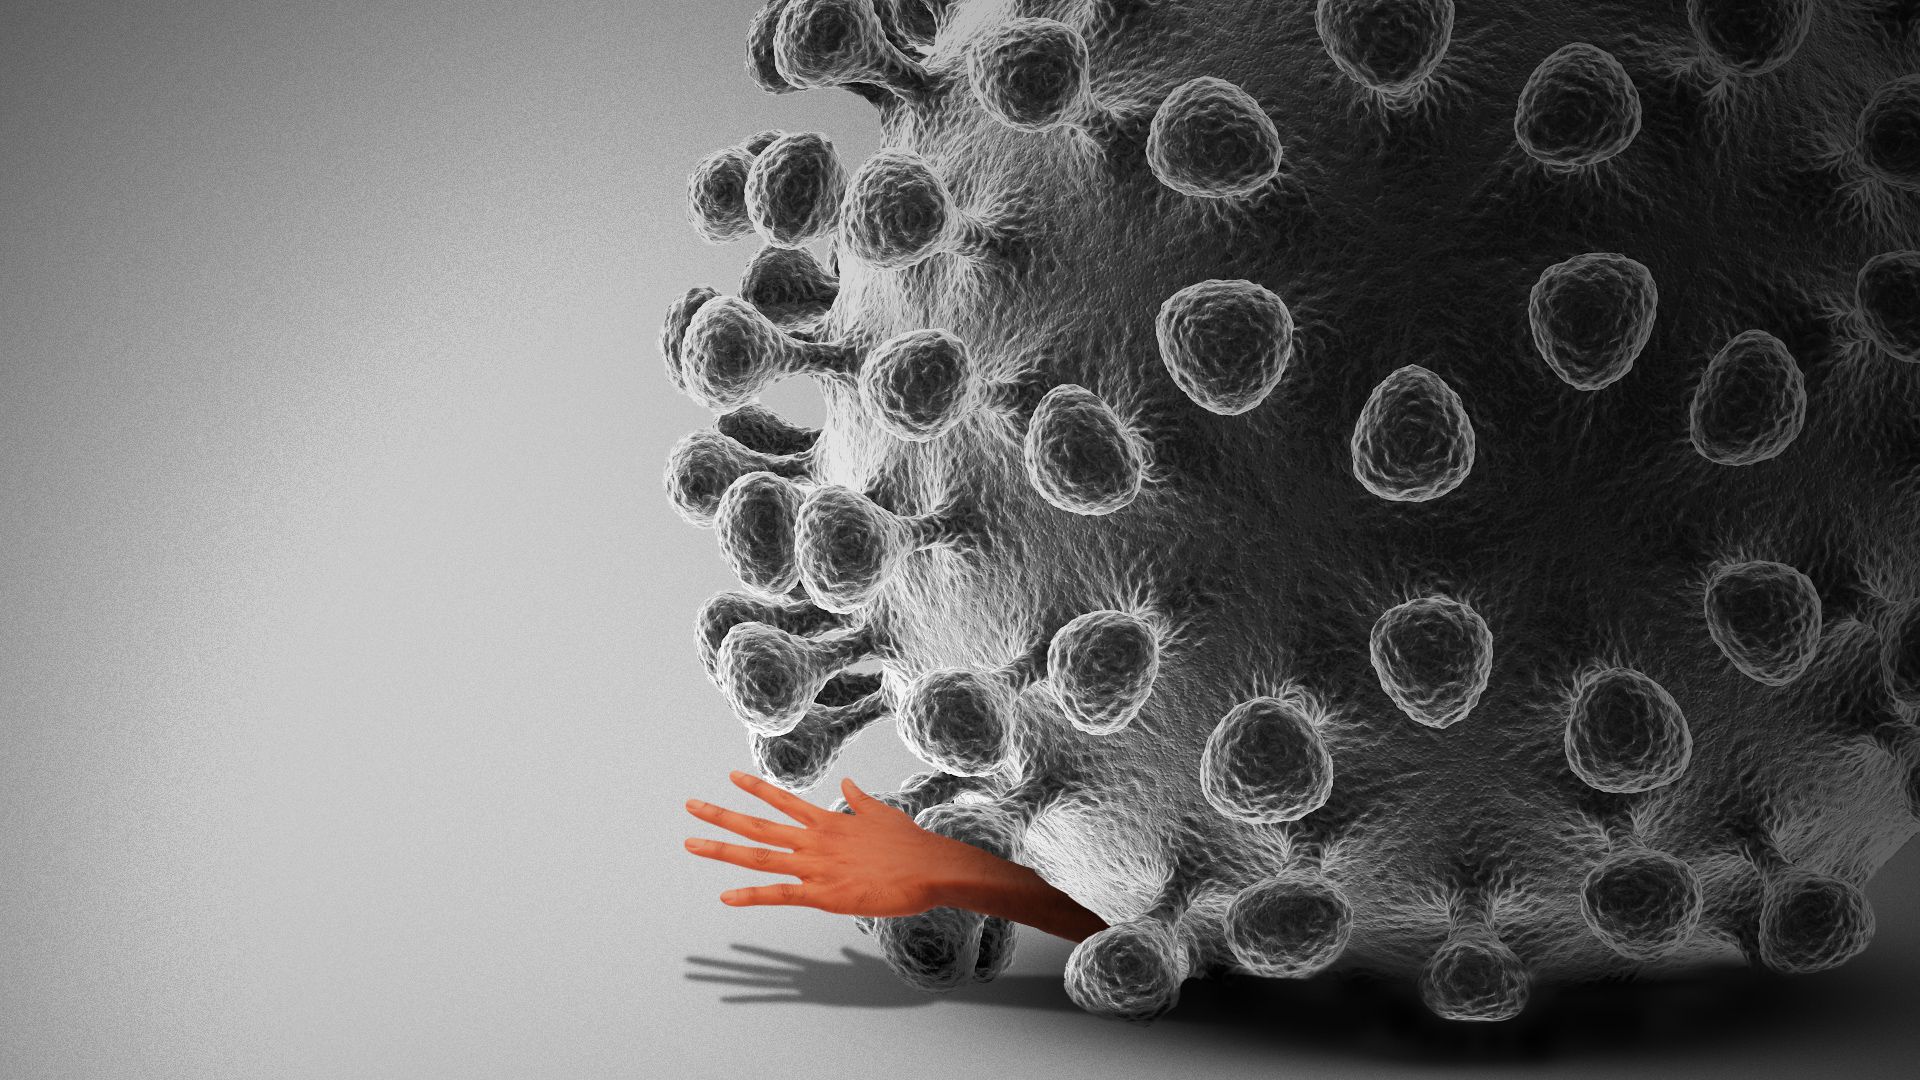
This coronavirus came from the bushmeat markets in China. It’s important to understand that this COVID-19 pandemic is a human creation. As Dennis Carroll pointed out, we made this problem precisely because of the type of species we are, and the planet we have created. Wild animal and plant products are being extracted from intact ecosystems at an unprecedented rate.
NOTE: the relationship between infectious diseases and the animal kingdom goes back further than we think. For a good background piece from long-time mate Robert Fanney click here.
But as we plunder these wildlands for the resources we “value”, we disrupt established ecological niches, including those of pathogen and host. Viruses and bacteria that evolved life cycles in a wild animal get opportunistic exposure to humans, for instance. As Carroll noted in a report for PREDICT:
It is no surprise that communities adjacent to exploited rainforests, with their wild animal markets, are the first affected by novel diseases, such as Ebola, HIV, Marburg, SARS, and, most recently, COVID-19. Most human infectious diseases have a zoonotic origin, even if most of these pathogens made the transfer from animals to humans many generations ago. But the emergence of new human pathogens seems to be speeding up, and 75 percent of the new diseases affecting us in the past 30 years have animal origins. As we change our planetary environment, introduce people into places formerly occupied by wild animals, and connect formerly separated natural and human elements, pandemics become inevitable. A 2007 study of the 2002-2003 SARS outbreak warned that “the presence of a large reservoir of Sars-CoV-like viruses in horseshoe bats, together with the culture of eating exotic mammals in southern China, is a timebomb.”
As noted in the article link above, Carroll has been a leading voice about the threat of zoonotic spillover, the transmission of pathogens from nonhuman animals to us. At the United States Agency for International Development (USAID), Carroll formed a USAID program called PREDICT, where he guided trailblazing research into viruses hiding, and waiting to emerge, in animals around the world. That program identified lethal viruses abroad to prevent their spread to the U.S. It had found 1,200 viruses (and 160 coronaviruses) in 10 years.
NOTE: last year it was actively working in China with the permission of the Chinese government. Two months before the Wuhan outbreak, Trump shut the program down.
Gaia Vince (a long-time Twitter connection of mine) has detailed many of these issues and thoughts in her book Transcendence: How Humans Evolved Through Fire, Language, Beauty, and Time (snippets of her book have peppered many coronavirus articles the last few months) :
Humans do not operate within their ecosystems in the same way as other species, even other top-level predators. We don’t have an ecological niche, but rather we dominate and alter the local—and now, global—ecosystem cumulatively to suit our lifestyles and improve our survival, including though habitat loss, introduction of invasive species, climate change, industrial-scale hunting, burning, planting, infrastructure replacement, and countless other modifications. It means that while other species do not naturally cause extinctions (except in rare circumstances, such as on islands), humans currently threaten 1 million of the world’s 8 million species.
We are a part of the biosphere and as we blunder into ecosystems we must be mindful of the greater systems that we are all a part of. A tweak to one part of the network can have far reaching consequences (good or bad) for us all. Our species has, in an instant of planetary time, become a potent planet-scale destroyer. As Colin Fripp notes (no link; long-time anthropologist buddy who abhors social media) :
The bigger point is that the human being, to begin with, has little concern to the rights of other living organisms on planet earth. We believe that all resource is disposable for the betterment, or momentary comfort or luxury, of humankind. This thought, which is also bound to our emotional lusting after comfort and luxury, is much closer to the cause than our closer proximity with animals is.
Taking Colin’s point further, the cynic in me thinks “if we lived in the same proximity to these animals as we now do, but in a respectful manner, would the diseases have appeared at all?” I tend to think not. I think there is a karmic reaction taking place which takes into account decades … centuries … of abuse towards other species of life on Earth, from the human being. These animals, in a sense, find their retribution by an evolutionary development of bacterias which eventually introduce themselves to humanity, and then import their destruction. Or maybe that’s the wine talking … a fine Domaine Paul Autard Côtes Du Rhône I am drinking while I write this.
Our leaders? I am going to avoid the politics in this post, saved for my upcoming piece “the politics of pandemics”. Suffice it to say the gross incompetence in the UK and other nations is on display every day. It seems managing the media is as important to them as handling the crisis. In the U.S. it is worse: incompetence exacerbated by malevolence.
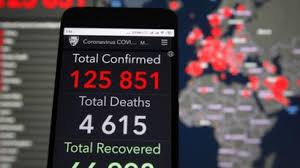
Asymmetric information, incentive distortions, systemic data paucity … oh, Christ. A data mess.
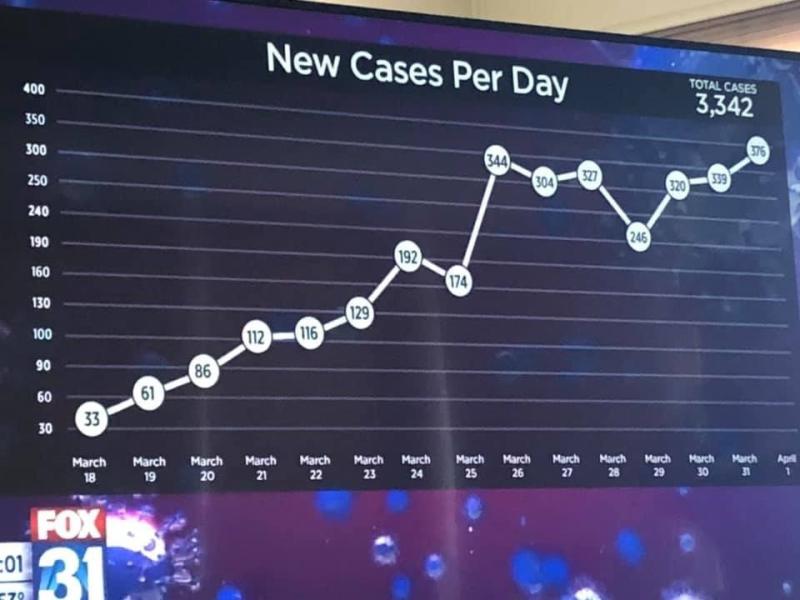
Ah … I think you need to work on that Y axis
And so with our fancy tech we went into battle. But COVID-19 showed us the “revolutions” in our information technology and biotechnology are still in their infancy. The World Health Organization identifies a new disease, a laboratory produces a new medicine, a country learns from early implementation successes to fight a disease … none of it can be immediately disseminated to update all the health services and doctors in the world.
This is not an issue of bad data. These were emblematic of the profound obstacles most countries faced in recognizing the magnitude of the threat posed by COVID-19, organizing a systematic response to it, and learning from early implementation successes in Korea and Singapore and Taiwan and elsewhere. There were alternative models for the containment of the virus successfully implemented … but there was a systematic failure to absorb and act upon this existing information rapidly and effectively, rather than a complete lack of knowledge of what ought to be done or the actual data.
Side note: it is why I think the confluence of AI, genomics, and automation are going to open up mega-possibilities in biotech and materials science.
The difficulty in diffusing newly acquired knowledge is a well-known phenomenon in both private and public-sector organizations. But accelerating the diffusion of knowledge that is emerging from different policy choices should be considered a top priority at a time when “every country is reinventing the wheel,” as several scientists have said.
But then came the worse issue: collecting, analysing and disseminating the data. Italy and the UK (yes, other countries, too, but they have been the worse) suffered from two data-related problems. In the early onset of the pandemic, the problem was data paucity. More specifically, it has been suggested that the widespread and unnoticed diffusion of the virus in the early months of 2020 may have been facilitated by the lack of epidemiological capabilities and the inability to systematically record anomalous infection peaks in some hospitals.
More recently, the problem appears to be one of data precision. In particular, in spite of the remarkable effort that the Italian government and UK government has shown in regularly updating statistics relative to the pandemic on a publicly available website, some commentators have advanced the hypothesis that the striking discrepancy in mortality rates between Italy and other countries and within Italian regions may (at least in part) be driven by different testing approaches. These discrepancies complicate the management of the pandemic in significant ways, because in absence of truly comparable data (within and across countries) it is harder to allocate resources and understand what’s working where (for example, what’s inhibiting the effective tracing of the population).
In an ideal scenario, data documenting the spread and effects of the virus should be as standardized as possible across regions and countries and follow the progression of the virus and its containment at both a macro (state) and micro (hospital) level. The need for micro-level data cannot be underestimated. While the discussion of health care quality is often made in terms of macro entities (countries or states), it is well known that health care facilities vary dramatically in terms of the quality and quantity of the services they provide and their managerial capabilities, even within the same states and regions. Rather than hiding these underlying differences, we should be fully aware of them and plan the allocation of our limited resources accordingly. Only by having good data at the right level of analysis can policymakers and health care practitioners draw proper inferences about which approaches are working and which are not. But good data was not available.
Moreover, are we counting the right things? Last weekend Susan Brown posted analysis done by Dave Dickson which contains a video he created plus two very detailed posts. There was a vibrant exchange across Linkedin. Susan’s questions were simple: (1) what technology is being used to collate all the data? (2) how accurate are these stats, really?
Dave has spent a lot of time on this material. The pieces are informative, analytical and lucid. You will not get lost in the math. And I want to add he has examined nearly everything available to date in the public domain. I spoke with Dave and I asked him to summarise his main points. He told me:
It’s really quite simple. Models are only as good as the data that goes into them. As time goes on, we will learn a lot more about the outcomes of this pandemic in countries around the world and the effectiveness of policies in mitigating the worst outcomes.
But crucially, modelling or any other analysis depends on not just the data that can be gathered, but are you looking at the RIGHT data.
My point is simple. The number of COVID-19 cases is not a very useful indicator of anything — unless you also know something about how tests are being conducted. COVID-19 statistics, especially the number of reported cases is highly incomplete. And we are seeing that the data on tests and the number of reported cases is highly nonrandom. In many parts of the world today, health authorities are still trying to triage the situation with a limited number of tests available.
If you’re not accounting for testing patterns, it can throw your conclusions entirely out of whack.
Nor are we taking a deep look into severity. What if we had just treated this like SARS (it is after all, SARS CoV 2). The panic that was broadcast by China triggered a chain of reactions starting in Italy that the world fell into step with one country at a time. Now it will take one major country to step out of the loop and show the world what is behind those scary red maps. Drop back the protocols to make the health services manageable and treat patients (and health staff) with a treatment and prophylactic protocol tested since 2003. Until that happens, the numbers will grow and panic will continue to tear all countries apart. You can’t stop the numbers growing when you are just counting test kits in a population that is already heavily infected (and continues to run with ineffective isolation protocols).
Dave updated his work and published a very good compendium piece which you can find by clicking here. But what you come away with is this: in so much of this “test data” the goal of that testing is often to allocate scarce medical care to the patients who most need it – rather than to create a comprehensive dataset for epidemiologists and statisticians to study, to know what is really going on.
Also, a very important point for this section from José Pedro Costa Araújo, Senior Project Manager, Digital Transformation, at Altice Portugal:
We forget we are in a lockdown to protect the risk population, not the healthy ones. So it’s not the total number of cases that matter – it’s the rate of infection in the risk populations versus the others. And guess what: risk population rates are much higher, which is a strong evidence of nosocomial nature of this pandemic which makes general lock downs a bad policy.
It must be much more effective to isolate and protect the risk groups, starting in hospitals and nursing home than the radical social distancing measures, which are very questionable to protect the risk groups and have extreme social costs that again are going to impact risk groups the most.
Finally, the initial numbers that started the hysteria were 1 in 3-5 infected and 1-2% mortality rates. We are now 4 months into the pandemic and the numbers are 0,02% of the world population infected and 0,001% in mortality rate.
I’ll let another one of my Linkedin mates, Robert DuWors, have the final word in this section. Robert’s expertise is large scale digital architectures, sometimes called called enterprise architecture, or solution architecture, and he has wrapped his brain around the implications of data paucity in this coronavirus storm:
We are seeing that, on a global scale, few people (maybe nobody) had any coherent data that was being collected in a disciplined and objective manner. Worse yet, the extent of the skew is unknown although often the direction of the skew may be guessed which still doesn’t create information from noise.
Death rates are certainly too low, but how much? Infection rates, too, by a lot, but it is not possible to tell quantitatively. The ratio of noise to noise is noise. Sort of like a White House dog and pony show complete with snake oil promotion. Although it is well established practice in financial analysis and macro-economics to make self mockingly profound statement about noise to noise ratios, they are still all bumph. Nothing sells management faster than one dubious number divided by another dubious number multiplied by a certain one.
I guess they assume that one dubious unit divided by another unit of dubiousness cancels out in some mysterious fashion to produce a reliable unitless co-factor (the dbu/dbu factor). We have been flying mainly blind with this outbreak. Controlled random sampling and a thorough recording of ground truth is far off which is unfortunate. It should not be because the second wave is likely coming … like Wave 1, in phases … within the next year.
And something important is happening as the coronavirus crisis continues in the U.S. Estimates of its lethality keep going down. On 31 March the White House estimated that, even with social distancing policies in place, between 100,000 and 240,000 Americans would die of COVID-19.
But then, according to Dr. Anthony Fauci (who serves as the director of the U.S. National Institute of Allergy and Infectious Diseases since 1984), estimates would soon be revised downward. Two prominent models designed by the University of Washington and the Johns Hopkins University Coronavirus Center came to the same conclusion. Assuming social distancing stays in place until June 1, U.S. deaths over the next four months would most likely be about 81,000.
Then by April 8, more than five revisions downward, to get to the current number: 60,415. That’s on par with the number of people estimated to have died of the flu in the 2019-2020 season.
It’s the data, again. Without widespread testing, epidemiologists have overestimated COVID-19’s fatality rate. And as A small underlying flaw in an exponential model can lead to estimates that are off by many fold. Models are only as good as the data that shapes them.
Doing data right
Many countries did it right. Take the situation in France. Tom Forth and I have been ploughing through French press reports and government news releases. A flurry of confirmed cases, deaths, and recoveries. France is the fifth highest country by number of confirmed cases. But France’s numbers are considered to be highly accurate because France counts what is happening in retirement homes, nursing and private homes. The UK does not, the U.S. does not. Many countries do not.
Moreover, when the media storm started in Italy, the UK, the US and elsewhere that “our health services will be overwhelmed!!” France created a dashboard showing the evolution of the epidemic, department by department, to visualize that evolution across its territory. The dashboard showed:
-the number of patients hospitalized to date
-the number of patients currently being treated in intensive care or resuscitation units
-the number of patients who have been able to return home, on a cumulative basis
-the number of patients who have died in the past
Hospital structures allowed mobilized beds to be made available in other departments, increasing their capacity or transferring patients to other hospitals. NOTE: this type of data has been collected since 2011 so it provided a benchmark.
Or take the example of New Zealand, the situation coming to me via daily news blasts from Pamela Williamson who I noted at the beginning of this piece. She told me:
We have been lucky enough to buy time to increase our preparedness after watching and assimilating the overseas experiences and responses. I have been tracking our figures daily since the start of our lockdown. We have climbed, plateaued, and then gone down. It’s still early days but we closed our borders some time ago and instituted intensive contact tracing.
We are currently ramping up testing especially in areas that are low in positive results, and are completely quarantining all returning New Zealanders. At the first sign of community transmission we upped our alert levels and actions. We have modelled our response on Taiwan, Singapore and South Korea. On 20 April the NZ Cabinet will consider whether or not to open our economy slightly. I am thinking it is possible, although I am comforted by the government response that much depends on whether our testing data is extensive enough and accurate enough.
Or this live map of hospital and ICU capacity in Germany which is quite amazing. In the U.S., the central national health agencies are struggling to compile this information, asking each hospital to send a daily email update. If the U.S. or UK or many other countries truly want to be better prepared for the next public health threat, they’ll need to modernize.

And then there is this.
Last week there was an interview with Dr. Jerome Adams, the U.S. Surgeon General, comparing coronavirus deaths to smoking fatalities. He said “more people will die from tobacco use than COVID-19, so take perspective” until somebody reminded him cigarette use is … voluntary. Nor do they all die in the same few weeks. Nor all needing the same medical equipment. Nor overrunning health facilities. He also tried to compare it to opioid deaths. I am amazed he did not mention that suicide has a higher mortality rate than Covid-19. It’s really dispiriting to hear this from … the U.S. Surgeon General.
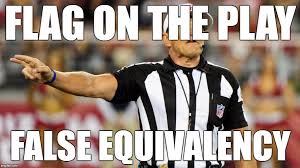
Or Fox News rattling off a list of noncontagious things that kill people but that don’t have equivalency nor put medical workers’ lives at risk:
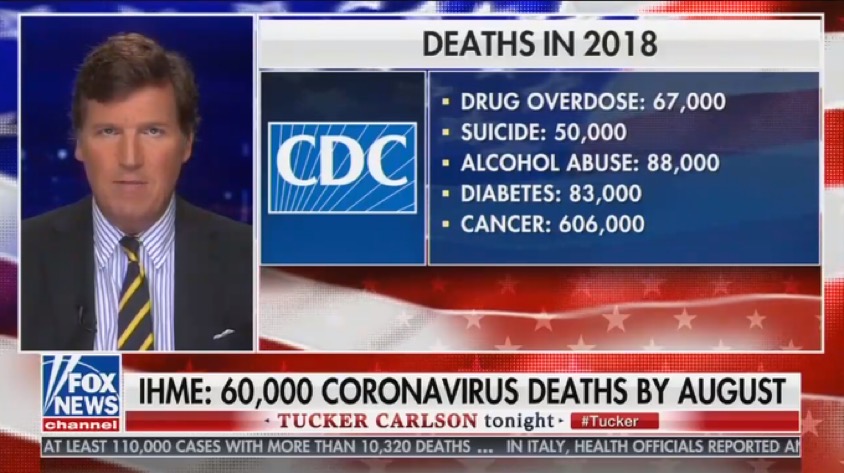
Or Wisconsin Republican U.S. Senator Ron Johnson who said “we don’t shut down our economy because tens of thousands of people die on the highways.”
False equivalence is a type of cognitive bias or flawed reasoning style. False equivalency means that you think (or are told) two things should have equal weight in your decision-making. If one opinion has solid data supporting it, but the other opinion is conjecture, they are not equivalent in quality. It happens all the time in politics. But now, given the asymmetric information and data paucity out there, this incentive distortion shit does not help.
Not all coronavirus data estimation is bad: the use of AI
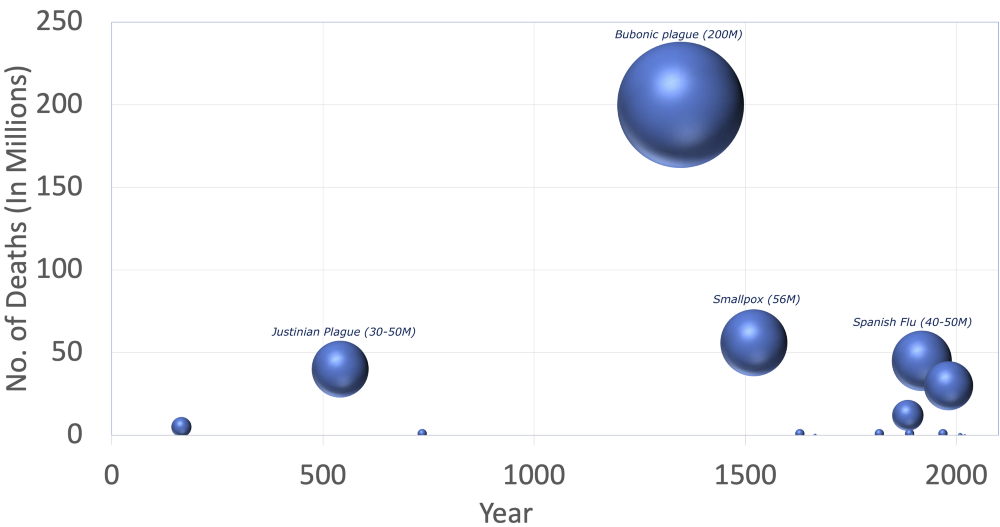
A Visual History of Pandemics (data source is the Visual Capitalist but please note the comment below at the end of this section. Richard Wynne-Jones takes an exception to the data presented)
As illustrated above, pandemics have killed about 300 million people in the last 2000 years. Although many of the death toll numbers are only estimates, the important thing to notice is that, as indicated by the crowding of bubbles in the right bottom corner, the frequency of epidemics has been increasing. As explained in many articles published across the Net, migration and urban expansion are bringing people into closer proximity to each other and animals, particularly in developing countries, increasing the likelihood of viruses spreading.
To slow down the spread of infectious diseases, governments are using several social distancing measures, including the closing of schools and workplaces, isolation, quarantine, restricting movement of people and the cancellation of mass gatherings. While such lockdowns are crucial for slowing the spread, there are serious concerns about the consequences such as potential food shortage and economic impact.
In an attempt to assist with this difficult policy decision, several data scientists have presented an algorithm that computes lockdown/release schedules for individual areas such as cities or regions, while balancing health and economic considerations. The schedules are computed as a function of disease parameters (infectiousness, gestation period, duration of symptoms, probability of death) and population characteristics (density, movement propensity). They evaluated the algorithm in simulation. They present a conceptual overview using plots. It’s quite detailed and the comprehensive technical details and assumptions made are presented in a paper posted here.
It is not an easy read but it is a Master Class on utilising reinforcement learning algorithms and simulation frameworks. And note: they make it clear they are not experts on communicable diseases, and they are highly aware of the challenges of producing accurate disease models. Therefore, they only used disease models from available literature, which have a fair degree of consensus. But subsequent to this publication I learned they are collaborating with epidemiologists who are dealing with the current coronavirus situation who have seen the benefit from a computational approach to address the spread of communicable diseases.
And a note on the graphic opening this section. An observation by Richard Wynne-Jones:
I need to take an exception to the graphic opening this section, the assertion that in the history of pandemics “the frequency of epidemics is increasing” (over a 2000 year span). If our record keeping (i.e. our data) is truly incomplete or misleading today, how can we be so sure of epidemic pandemic events (local, regional and global) over 2000 years ago?? Many may have gone unrecorded. The relatively smaller impact of COVID 19 versus say the “Bubonic Plague”, the “Spanish flu” et al would suggest that many pandemics of this magnitude may never have entered the historical narrative let alone be represented by rudimentary statistics “of the distant past”. Placing COVID 19 in an historical context is misleading for the very reasons pointed out in your article ……. unverifiable, misleading and in some cases non-existent evidence.
Not all coronavirus data estimation is bad: the use of mobile and satellites
Facebook, Google, many telecoms, etc. are sharing anonymised data about people’s movements and high-resolution population density maps, which help them forecast the spread of the virus. Facebook and Google search data has been used to track infectious diseases.
Note: the use of contact tracing and mobile tracking programs have raised scores of privacy concerns. That’s all fodder for a subsequent post. Dave Gershgorn and I have mapped how the coronavirus is driving new surveillance programs around the world. More to come.
One of the most interesting … and which received terabytes of press coverage … is how X-Mode and Tectonix tracked the location data from the phones of people who visited the beach in Fort Lauderdale, Florida and who made national news when they ignored warnings to practice social distancing despite the worsening coronavirus pandemic. For a good review, click here. I had an opportunity to interview a programmer at Tectonix and I’ll include that in my surveillance report.
Google uses the anonymous location data it collects from Android phones to build global indices of how much people have stopped moving around, for every country and major city. Governments use this data for insights into what has changed in response to policies aimed at combating COVID-19.
Nokia has been measuring global data traffic changes and demands to help telecoms manage data loads. Interesting bit: Disney+ is 18% of streaming-video-on-demand traffic in some countries. In the U.S., Comcast, Verizon, all the U.S. cable networks and even the U.S. Federal Trade Commission is measuring network data to manage data loads.
Meanwhile, data from satellites can play a role larger than showing us that we stopped going places: it can help reveal where to deliver help to people—and which spots on the globe might need aid next. For an example, click here.
As I noted above, Nicolas Granatino has performed yeoman work in his daily coronavirus reports which you can read and subscribe to by clicking here. One of his masterful bits is a compendium of coronavirus data sources he has compiled and updates on a regular basis. His latest batch:
1. MRC Centre for Global Infectious Disease Analysis started to publish weekly death estimates for countries (link)
2. US Center for Disease Control and Surveillance (CDC) publishes “A Weekly Surveillance Summary of U.S. COVID-19 Activity” (link)
3. Google has published a new website to “See how your community is moving around differently due to COVID-19”. They have a lot of data to do so… (link)
4. The Financial Times has a data tracking page which is in front of the paywall, looking at cases and fatality curves for selective countries and metropolitan areas/region. It is not as extensive as the Madlag link below, where you can see static as well as animated images for a greater number of individual countries. (link
5. The Institute for Health Metrics and Evaluation (IHME) is an independent global health research center at the University of Washington (UW). It has put out a simulation for the US (overall and by state) of what is the expected shortfall in health capacity (bed, ICU, ventilators) and when is the expected peak of the epidemic for each state. It has now added countries in the European Economic Area (EEA). A valuable resource. (link)
6. Another valuable resource by Unacast ( a data company providing human mobility insights). Their “Social distancing scoreboard looks and compares (State by State and County by County), the change in mobility to prior to COVID19 (link)
7. Country by Country Curves: This is a GitHub made by my friend Francois Lagunas. He has written a script to scrape deaths and number of cases in order to visualise the rate of growth on a logarithmic scale. Great resource (link)
8. CityMapper has started to produce City Mobility Index to show how much a City is moving. This is a very good indicator of how well lockdowns are respected around the world: Barcelona (4% of city moving) at one end and St Petersburg at the other end (68% of city moving) for yesterday (link)
9. A great resource put together by Ben Kuhn and Yuri Vishnevsky. At a time when we need solidarity and cooperation, I prefer their subtitle “We need stronger measures, much faster” than their title. It’s a simulator on what case growth looks like depending on your community’s measures. Fantastic resource to stir communities and governments to action (link)
10. The COVID19 dashboard for Germany is one of the best around. (link)
11. A helpful guide by VOX of the “9 coronavirus pandemic charts everyone should see” (link)
12. Data and chart regularly updated by the Centre for the Mathematical Modelling of Infectious Diseases at the London School of Hygiene & Tropical Medicine. It maps the effective reproduction number (also known as R0) of COVID19. You want to get it below 1 as fast as possible to contain an epidemic. (link to see charts and more data about your country)
13. This is a great COVID19 Dashboard prepared by Andrzej Leszkiewicz. Andrzej has also written an introductory and explanatory blog for it (“Coronavirus disease (COVID-19) fatality rate: WHO and media vs logic and mathematics”). I particularly like the country comparison tab, which allows you to track and benchmark the curve of the epidemic (number of cases and deaths) in your country with that of another. Very well done and informative. (link)
14. “Going Critical” by Kevin Simler is a detailed interacting essay talking about complex systems, the importance of understanding networks, modelling and how this applies to: memes, infectious diseases, herd immunity, wildfire, neutrons and culture. Must read (link)
15. Singapore remains the gold standard of dashboard. Here is an article with the Best and Worst of all dashboard in the world, with Pros and Cons prepared by Neel V. Patel for MIT Technology (article)
The future is … ah … well …
![]()
We don’t know who we’ll be by this time next year. We don’t even know how many may no longer be around when this is over. Nor do we know when it will really go away or how different our lives and lifestyles will be once the pandemic is finally behind us. Will it ever be behind us? Will time restore us to who we were scarcely two months ago when things used to be, let’s just say, normal? I keep reading about how this adds up to a once-in-a-generation transformation, that it will shift permanently the balance of power within societies and remake relationships between states. There certainly is the opportunity for populism to tug nation states towards flag-waving nationalism, prefacing another turn towards deglobalisation. I think it will be more like inertia, attempts to muddle through, with adjustments at the margins. I do not see a refurbishment of a very threadbare social contract.
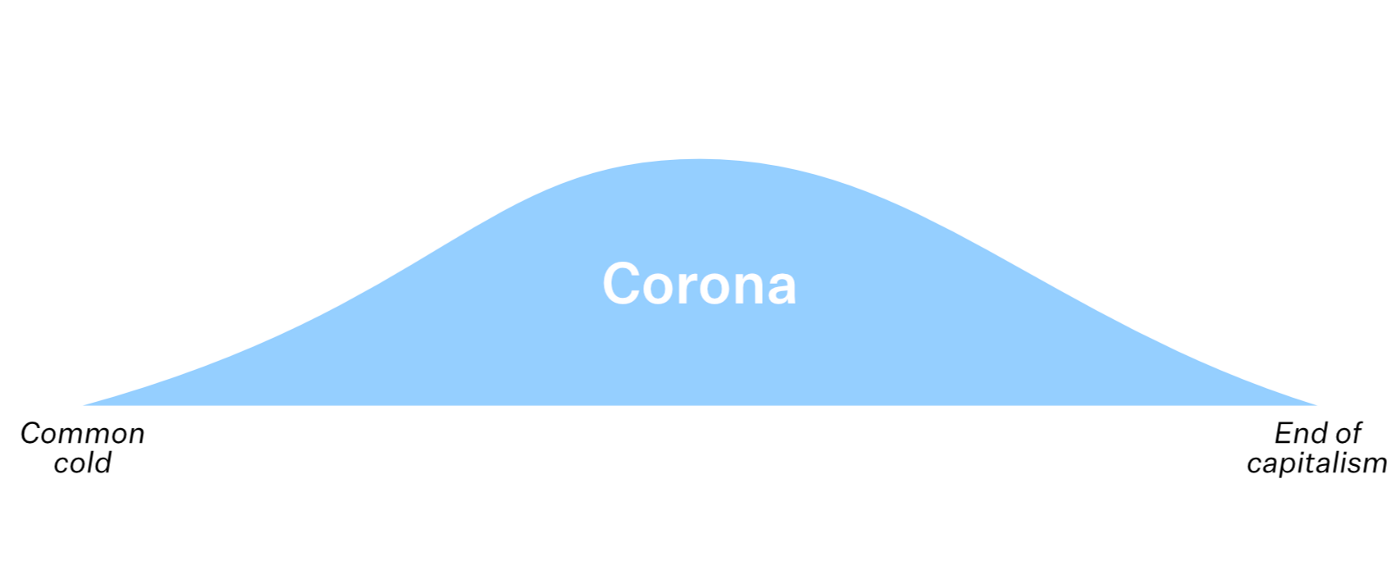
I think the biggest problem is the impact of this virus is pitched somewhere between the common cold and the end of capitalism, and no one knows exactly where.
That, and the ceaseless torrent of both events and discussion about the events, makes it difficult to write about. As a result, these articles hover between personal reflection, cultural observation, and possible insights for policy, design, and action, without ever really settling. This is not a time for conclusions, though. I refuse to offer up strategies, or ideas here. It is not the time or the place: people are dying and I’m not a doctor.
I love science. In the collective imagination, science is about uncovering some profound truths. In reality, however, it is really more about reducing uncertainty to a degree where we can say “well, maybe my theory is not that wrong.” The scientific method, which we honed through the Enlightenment Period, is not really about “establishing” truth as it is about “increasing confidence.” There’s never really any truth, just some shades of it, and only in as much as we can observe it. It’s beautiful because as someone who has problems with ambiguity, I find it soothing to know that maybe it’s OK not to know everything.
Well, ok, I also probably love science because I am not a scientist. I have a degree in science (physics) and keep myself immersed in it. But I never practiced it. The theory of science is beautiful, but to practice it is a grim affair.
The situation is too complex to carelessly stumble into. As Dan Hill, the Director of Strategic Design at Vinnova, the Swedish Government’s innovation agency, says “it would be like hurling a PDF at a hurricane”.
Not that the strategies, or ideas, don’t exist. My “day job” seems to be discussions across my Linkedin and Twitter extended professional community, who are split across varying degrees of lockdown across most timezones. I credit Niall Ferguson who sent this out to one of my groups, a quote from Kazuo Ishiguro’s Nobel Prize lecture in December 2017:
“One person writing in a quiet room, trying to connect with another person, reading in another quiet — or maybe not so quiet — room … But in the end, stories are about one person saying to another: This is the way it feels to me. Can you understand what I’m saying? Does it also feel this way to you?”
We read, we discuss, we devise, we review. But so far, despite the firehose of speculation about “teachable moments”, nobody is taking the egotistical plunge to write “here is what will happen”. We are not exactly those French writers sitting in our country homes above the fray.
By next holiday season this fall, we’ll know many will have lost their jobs, their incomes, their homes, their health benefits, etc. Predicting the disastrous ripple effects on financial markets? Nah. Predictions are meaningless. The modern world has seen nothing like this. André Aciman, the Egyptian-Italian-American writer, noted on his blog this week:
I am reminded of the AIDS crisis before we even knew there was an epidemic or how it was being transmitted. All we knew was that it was deadly. Nothing more. People disappeared, one by one. Anyone could be next. And sometimes they were, eventually.
Here are two more examples.
The world had no idea what effect 9/11 would have on New York, nor did we have the foggiest notion of how desolate our streets would look, or how, without tourists in a city bustling with people from everywhere, New York could within a few short days drop its swanky, up-to-the-minute face and slink back to what it used to be in the early 1960s—a dark, stark, bituminous city best captured by Billy Wilder’s black and white film about two forlorn characters who can’t even fall in love.
After the Twin Towers fell, gone was the ferment in the streets, Chinatown vendors suddenly disappeared, a hollowed-out Madison Avenue was limited to business types, no one shopped, people were numb-stunned, and we all cringed each time we heard the doleful whine of sirens racing up and down deserted avenues, as did the sirens once during World War II—as do ambulances all day and night now. Time had stopped, the center barely held, and life had changed unimaginably. We were still the same, but we needed our friends, others called from around the world, and we wanted our children and loved ones close by.
And we do all of this while hundreds of small details of everyday life is changing around us. Every day brings more. Who can use the term “gone viral” now without shuddering a little? Who can look at anything any more – a door handle, a cardboard carton, a bag of vegetables – without imagining it swarming with those unseeable, undead, unliving blobs dotted with suction pads waiting to fasten themselves on to our lungs?
Who can think of kissing a stranger, jumping on to a bus or sending their child to school without feeling real fear? Who can think of ordinary pleasure and not assess its risk? Who among us is not a quack epidemiologist, virologist, statistician and prophet? Which scientist or doctor is not secretly praying for a miracle? Which priest is not – secretly, at least – submitting to science?
Again, I feel we should at least be carefully and respectfully observing, logging, and discussing those details. As well as endlessly washing our hands, Zooming old friends, using Home Karaoke Station, holding on-nomi drinks parties, inventing new rituals, all partly due to this enforced social distancing. And this is deeply cultural, of course. As Marco Vallini, my chief videographer, based in Rome wrote:
Living and working in Italy, the everyday comfort with interpersonal tactility is remarkable. It is generally quietly joyous, part of the culture. Italy is a very touchy-feely place … but not right now. Just as Alexandra, one of our graphic artists based in Sweden says that Sweden is quite huggy, as it happens .. but again, not right now.
Ok, enough. I digressed from “the data theme” and broke one of Christian’s writing rules. There will be much more to come as I plunge back into “the politics of pandemics”, the next piece in this series. For me, I’m writing in order to not forget, forcing the deceptively simple act of putting one word in front of another as a way of figuring out what to look for in the blazing environment around us.