Pour la version française, cliquez ici
Per la versione italiana clicca qui
Für die deutsche Version klicken Sie hier
Para la versión en español, haga clic aquí
Plus: as the MIT Technology Review noted earlier this week, over 24,000 coronavirus research papers are now available in one place. The data set aims to accelerate scientific research that could fight the COVID-19 pandemic. It is still very early days but using AI to draw conclusions from those papers has already produced a very tentative insight.
Plus: “The Big Picture”. Tomas Pueyo has followed up his mega post “Why You Must Act Now” (40 million views and 30 translations) with “Coronavirus: The Hammer and the Dance”. It is a brilliant summary of where we stand.
Plus: “How the Virus Got Out” – The New York Times has put together a brilliant motion graphic.
22 March 2020 (Brussels, Belgium) – As I have noted in my series of posts about the COVID-19 pandemic (you can access my archive by clicking here) I have noted that people are mixing and matching inaccurate statistics that measure different things and using this mish-mash to make irrational predictions. This has led to the weaponizing of false and misleading statistics.
One chap who cuts through all of this is Azeem Azhar. Every weekend (with mid-week supplements) he publishes Exponential View, a brilliant newsletter. He is one of those people who bridges the gap between two cultures – that of technology on one end, and humanities on the other – to provide a holistic understanding of our near future. More about him and the newsletter at the end of this post.
This past week Azeem interviewed Adam Kucharski, a mathematician and epidemiologist at the London School of Hygiene and Tropical Medicine, to discuss the state of the outbreak. It was “Pandemic Modeling 101”. I have links to the audio below and my media team took the liberty of creating transcripts in English, French, German, Italian, and Spanish. We’ll have Dutch and Portuguese shortly and add other languages next week. NOTE: we are beta testing a new neural machine translation software so please bear with some errors but time was of the essence. However, my translation team did give all the translations a quick review.
Adam is the author of The Rules of Contagion: Why Things Spread – and Why They Stop which arrived (ironically) in my Amazon shipment yesterday. The explores the underlying principles behind contagion. I will have a few brief comments on the book in a moment.
In this interview Azeem and Adam discuss (and I am only skimming the surface; it is chock-a-block with information — simply a “must listen to” and must read” piece) :
• What are the key drivers of epidemic curves—and how predictions are put together
• How behavioural changes affect modelling and prediction
• When is a population ‘virus-free’
• What levels of testing are sufficient to tackle the current crisis
And I must say Azeem simply nails it with his comment on paradoxes.
Here are the links:
• Audio
I am only half-way through Adam’s book so just a few quick points:
• It is a breeze to read. Adam, who has worked on the fight against the ebola and zika viruses, believes that to master the diseases we first have to master the arithmetic. Vaccination, our most familiar weapon against epidemics, is so effective because it reduces the susceptible population: give just half of them immunity, and you halve the number each carrier can infect. Quarantine works in a similar way on the number of interactions carriers can have. Both can bring down that R number: get it below R1, and simple maths dictates that new cases will decline and the outbreak will end.
NOTE: In the 1970s, a mathematician called Klaus Dietz picked up on the idea. What if you established the average number of people that a new case would infect? Call it the reproduction number, or R. You could then calculate how fast the disease would spread, how many people would catch it and, if you could intervene in a way that reduces R, how effective measures to fight it might be.
• Kucharski’s maths is illuminating in other ways. Quoting the Times review of the book:
Take schools: it turns out that, as parents have long suspected, they are a disease sink. In July 2009, H1N1 flu infections skyrocketed in the UK, but as soon as the school summer holidays ensured the kids were coughing over their PS4s rather than each other, the rate plunged to near zero. Or how about the close encounters that spread many viruses: UK residents typically have physical contact with five other people a day, while for the touchy-feely Italians it’s twice as many. Perhaps that buttoned-up British reserve will be the saving of us.
• Suddenly, the R number looks less like an academic device and more like a matter of life and death. Coronavirus rates somewhere between R1.5 and R3.5, on current estimates. That sounds like a small range, but as Adam Kucharski’s book points out, it has huge consequences.
This is a hell of a moment for a book like this to come out, and some might assume it’s a lightning-fast cash-in on a global tragedy. They would be wrong. Coronavirus hadn’t even appeared when Kucharski delivered the manuscript, so the disease isn’t directly addressed here. If you you really want to know what we are up against, read the book.

The trove of coronavirus research papers
As most of you know, MIT Technology Review noted earlier this week that over 24,000 coronavirus research papers are now available in one place. The data set aims to accelerate scientific research that could fight the COVID-19 pandemic.
It is still very early days but using AI to draw conclusions from those papers has already produced a very tentative insight. Brian Roemmele has reported that we can build human telemetry systems through a small wearable biosensor array that serves as an early warning of infection. He lays it all out in a Tweet here. He has been an exceptional follow in all of this.
The Big Picture
Tomas Pueyo has followed up his mega post “Why You Must Act Now” (40 million views and 30 translations) with “Coronavirus: The Hammer and the Dance”. It is a brilliant summary of where we stand, and where we are likely to end up depending on what measures our governments take. It’s a must-read. Click here.
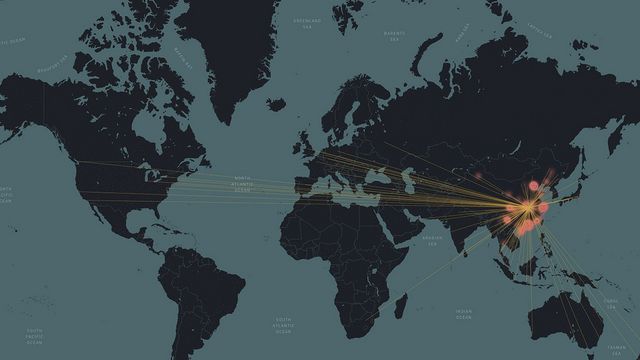
“How the Virus Got Out”
The New York Times has put together brilliant motion graphic. The most extensive travel restrictions to stop an outbreak in human history haven’t been enough. It is an analysis of the movements of hundreds of millions of people to show why. Click here.
I’ll finish with Azeem Azhar, publisher of Exponential View, from today’s issue:
I’ve studied systems and fast growth curves, exponential ones, for many years. Systems are adaptable until they aren’t, then they become brittle, they may undergo a phase-change. Exponential curves can be gradual until they aren’t. They come at you fast. They drown you. And they keep going and going. Until they don’t. But when is that?
As I have noted, Azeem’s newsletter has become THE SOURCE – not just for this pandemic but for a whole range of issues via our two cultures – that of technology on one end, and humanities on the other. To subscribe to his newsletter, click here.