Find out how a former quality engineer and product manager at Kennedy Space Center moved to the West Coast, started dropping in on big waves, tuned into data, founded Stormsurf.com, and currently crunches more than 4 terabytes of swell data per year.
18 September 2015 – Surfers have been catching massive waves at Pillar Point in Half Moon Bay, CA since the 1960s. The first legitimate contest was held in 1999-2000, but what most of us know as Mavericks didn’t launch until 2004 with the help of big wave rider Jeff Clark. Unlike the Kentucky Derby or March Madness, Mavericks doesn’t happen every year. It was a no-go in 2007 and again in 2009, and last year.
Why?
The problem isn’t a lack of big swells, but whether the perfect one will rock Pillar Point during the contest waiting period (Jan. 1 – March 31) — and then predicting the if and when so everyone can get in place. The 24 surfers who compete at Mavericks are given 24-hours notice to show up. Extending the waiting period and tethering the surfers to Mavericks wouldn’t be fair since they make their living traveling to contests all over the world. Plus, the arrival of late spring welcomes gray whale migration and seal pups, which results in crowded waters.
So how do you forecast one of the most celebrated big wave contests in the world? As one surfer has said: “It’s no longer a secret where you have three puffs of smoke announcing who the next Pope is gonna be. You definitely couldn’t hold a contest of this magnitude — 50,000 spectators in person and another 1+ million on webcast — and get mobilized in time if it weren’t for all the technology.”
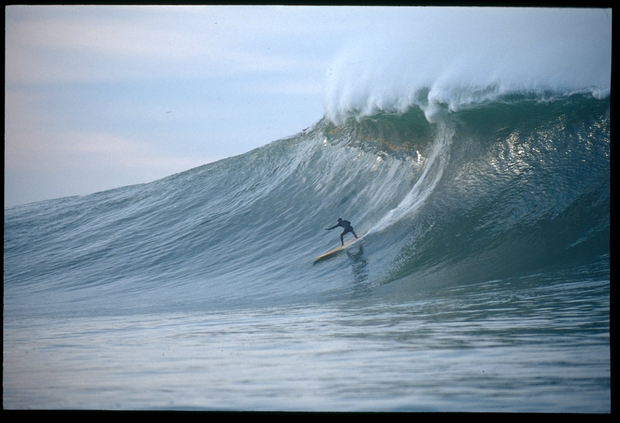
The short answer: datahead surfer Mark Sponsler (surfing the Mavericks above and pictured below).
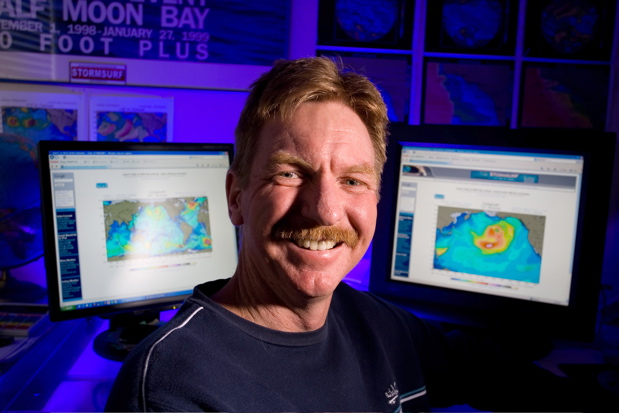
Datahead surfer, Mark Sponsler
In the early 1980s, Sponsler was surfing and working at Kennedy Space Center in Florida, where he did a 15-year stint. A self-described “bithead,” he started to get weather curious. Back then, though, hobbyists and surfers had a heck of a time obtaining any real, tangible data. Quoted in a surfing magazine (all quotes below come from two magazine articles I read in Surfing Magazine and Varial Surf Technology which writes about the physics/technology involved in surfing):
“When I first started trying to put stuff together, there was no Internet. There were no publicly-available [wave] models. You’d get in your car and drive to the National Weather Service office, and try to make sense of some charts they had posted on a wall.”
Around 1984, NOAA began installing some of its first weather buoys. A big leap forward for generating potentially-solid swell data. Yet, the best Sponsler could do — aside from driving back to that office — was to listen to NOAA weather radio. And even then, he’d only get a rough idea of what was going on to then try to extrapolate the oceanic tidbits in surf terms.
By the time Sponsler’s wife got a job opportunity in San Francisco, he had already caught the big wave bug paddling out in Hawaii. Looking for a change, they moved out west and never looked back. Soon after, he’d not only befriended Mavericks legend Jeff Clark and tackled Mavericks, but Sponslor became a “power user” of the early 90s Web. NOAA and CDIP continued to anchor more buoys updated with fancier sensors. New and improved weather satellites launched. Universities and institutions started to create and freely distribute waveand weather models. And with that great, big data dump, of course, began Sponsler’s efforts to mine as much as possible.
In the 90s, Sponler started forecasting surf Mavericks via email blast (he still takes daily calls from any one of the 30 big wavers he calls the “traveling gypsies floating around the planet chasing surf”). As the list ballooned in size, a web site started to make more sense. Plus, he wasn’t satisfied with the way much of the disparate data were being presented online. He started coding.
Launched in 1998, Stormsurf operates today with just three par-time employees, not including Sponsler, whose day job is as a tech product manager at a major health care provider.
His back-end, he admits, isn’t state of the art, but it gets the job done. He’s running four, 3.0 ghtz single core boxes each with 4 GB of RAM. Ancient by today’s standards — and he knows an upgrade is due — but for the past five years his application servers have run just fine maxed out at 100% CPU, at probably 50% of every minute they’re running.
The total throughput — the raw GRIB files and various other data he downloads specific to wave/weather models and flash output — is roughly 2.5 GB per model run four times a day. That’s 10GB a day or almost 4 terabytes every year to forecast worldwide. Not jaw-droppingly-impressive if you’re a Google or Microsoft, but a far cry from driving to the NWS office to stare at 2D charts tacked up to a wall.
And just what are Stormsurf’s servers crunching?
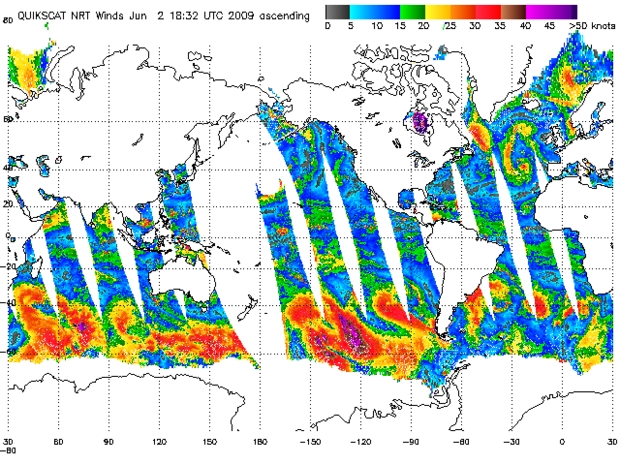
The main components are wind speeds, wave models and the Jason-1 satellite. The wind speeds are provided by satellites that pass over twice a day, offering almost 100% oceanic coverage. The satellites, including NASA’s QuikSCAT, can predict wind speed to within 2-3 knots.
The next step is to input the raw figures into several of the aforementioned wave models, which extrapolate a predicted wave height. (I’m simplifying the models which take into account huge swaths of data like seafloor mapping)
The last main component is Jason-1, which helped generate its first image in 2002. As the satellite polar orbits the Earth multiple times a day, it beams down radar into the center of a storm to calculate the wave height — down to an accuracy of 6 inches.
From there, as a swell approaches, Sponsler turns again to those buoys to provide secondary confirmation. NOAA has 991 buoys worldwide, but for Mavericks the most vital ones are those off the coast (duh). Armed with solar panels, computers, accelerometers, and directional sensors, the buoys measure the sea height, swell height, heave and throw of the ocean, and the energy distribution across entire frequency spectrum (from 3 seconds up to 40 seconds). If there are multiple swell trains hitting at the same time, the spectrum will help Sponsler identity it.
The buoys uplink continuously to satellites so the data can be downloaded to a central processing center in Maryland, which then chews everything in real-time so it can post to the Web. Those 1s and 0s are distributed in multiple formats, including the raw ASCII text flat files Stormsurf chops into bite-size chunks to run in parallel, and then construct its own buoy reports, which detail current conditions, provide historical surf height and chart out barometric, air and water temperature over time (for surfers or aspiring weatherheads who want to learn).
And this year … 2015/2016 … we are in a “Super El Niño” year. This is when warm water builds up off the coast of South America and enhances the Jet Stream in the North Pacific, therefore instigating big winter storms. During La Niña, you get the opposite — colder water off the coast, which suppresses storm development. For Mavericks, you also want big storms, strong low pressure developing on the International Date Line pushing in towards the west coast of Alaska, but not too close. El Niño is good for that, but once you hit the core of winter, the storms can get driven right into the coast, which isn’t good for surf.
Needless to say, the list of atmospheric variables is vast and nature is fickle. For long-term forecasting (3-6 months out), Sponsler says the data only go so far, too. He examines everything obsessively, but for the time being, can arrive only at a probability for the number of storms, not some decisive moment for a certain storm hitting a certain beach. Thus, Sponsler calls the long-term forecast the “domain of artistry, voodoo and witch doctor sort of stuff.” He is never quick to pull the trigger either direction:
“This is not an exact science. Whenever you go and declare it dead or alive, then something will always happen. It is nature; it does it’s own thing.”
Why it is important in sailing
We study tides and water depth as sailors. Tides and water depth also affect waves. When the tide is high, the water is deeper. When the tide is low, the water is shallower. As the tide moves from high to low, the wave energy goes to the sea floor, slowing down the wave but concentrating the energy upwards, intensifying the wave height.
But why doesn’t the whole coastline get big waves when the conditions are right?
The final ingredient is underwater topography. Without mountainous regions that rise steeply from the ocean floor, waves can’t become the monster waves at a place like Mavericks. As waves cross what surfers call a “launching pad,” the part of the wave that hits first will slow down, then bend into “V” formation, focusing the wave energy into one intense spot. This is called refraction. At this point, the energy explodes and wave height can more than double in an instant. The explosion is so intense at Mavericks that it registers on a seismograph, standard equipment on any sailor’s boat.