The database was massive. Analysing such a volume of data wasn’t a job for Excel or any existing database management programs. It required sophisticated machine learning toolkits: Python, Neo4j, Linkurious, Fonduer and Scikit-learn softwares.
Herein a brief description of the technology used, with a postscript on the fastest-growing category in the enterprise software market: database analysis

11 October 2021 (Chania, Crete) — Multi-million dollar beachfront properties purchased by King Abdullah II of Jordan through shell companies. $1 billion in foreign assets hidden away in trusts in the U.S. A $22 million chateau purchased on the French Riviera by the Czech Republic’s prime minister through offshore companies. How the U.S. functions as a tax haven.
These are just a handful of the mass of revelations that came to light through the Pandora Papers investigation.
Led by the International Consortium of Investigative Journalists (I am a sponsor and I have worked with ICIJ teams on past investigations), the Pandora Papers investigation comes just 1 year after the FinCEN Files and 5 years after the Panama Papers. This latest investigation – the largest journalistic collaboration ever undertaken – exposes the truly global nature of tax and secrecy havens that enable billionaires, politicians, and fraudsters to conceal their wealth and assets.
The International Consortium of Investigative Journalists (ICIJ) has spent the best part of a year coordinating simultaneous reporting from 150 different media outlets in 117 countries. And it involves a lot of technical infrastructure to bring the stories of financial issues to light. They had data from 14 different offshore providers. Work began on analysing the data in November 2020.
A short note on security: The 600 or so partner journalists that “interrogated” the data did so by accessing the ICIJ files through a secure authentication platform. Contact with the ICIJ uses PGP to encrypt emails and multi-factor authentication to access the servers – of which there are up to 60 running, a number that can expand to 80 when indexing files. SSL client certificates were also a must-have for partner journalists.
Sometimes it was hard for partners to just connect to ICIJ servers. However, once they have access to the data, the media partners are able to perform their own analysis on the data. A data-sharing API allows data scientists working for media partners to mine the documents within the Pandora Papers themselves using their own scripts or machine learning tools. As one ICIJ member told me “We have to be ready for anything all the time. It can turn you paranoid, because there’s so much at stake here.”
And for good reason: the ICIJ believes it has been subject to at least two attempts to break into the servers hosting the Pandora Papers since they and their partners began approaching politicians and businesspeople named in the documents for their stories in the last week. My contact said “As soon as we started to send comment papers, we started to have attacks on the servers”. On October 1, the ICIJ website withstood a distributed denial of service (DDoS) attack that saw it bombarded with six million requests a minute. Another suspected attack occurred on October 3, when the servers started showing unusual behaviour.
So the first challenge was to get the data. My ICIJ contacts told me they exchanged messages for weeks and months with their sources, and at a point they had to find a way to get the data. Initially, the ICIJ brokered a deal with its sources that would allow them to send the data remotely without needing to travel, but as the size of the document dump grew, so did the challenges in ensuring it all could be sent to a secure server. Some members of the ICIJ team met directly with sources and collected huge hard drives containing the documents.
But the sheer size of the leak was tricky to navigate. They’re massive. Analysing such a volume of data isn’t a job for Excel or existing database management programs or eDiscovery software. It is beyond their capability. You just can’t just go at it with classic tools. There’s nothing in the market for journalists that can ingest so much data.
As I will discuss further below in this post, it is the machine learning toolkits in Python, Neo4j, Linkurious, Fonduer and Scikit-learn softwares that allow you to do deep-dives and serious search. The “usual suspects” in enterprise search will just not do it.
Worse, four million of the files were PDFs – notoriously bad to interrogate. PDFs are horrible to extract information from. And they weren’t ordinary PDFs either: seemingly unrelated documents were scanned together into single PDF files without rhyme or reason. You might have copies or emails or registers of directors within the information we were interested in.
How did the ICIJ and their media partners around the world investigate the most expansive leak of tax haven files in history? A combination of amazing technology and methodology. First, some background.
What is the Pandora Papers investigation?
For an overview, watch this short video produced by the ICIJ:
At the heart of the Pandora Papers is a truly massive amount of documents – “a tsunami of data” in the words of the ICIJ. The leak included 11.9 million records from 14 different offshore services firms, which amounted to 2.94 terabytes of data. It took more than 600 journalists from 150 media organizations over a year to fully investigate.
Pandora By the Numbers
The numbers were staggering:
• 600 journalists from 150 media outlets in 117 countries
• 2.94 terabytes
• 11.9 million files
• 14 offshore service providers (like law firms and banks)
• Oldest documents from 1970, but most between 1996 and 2020
• Shell companies in 38 jurisdictions, including the United States for the first time
• 27,000 shell companies and 29,000 ultimate beneficial owners
• 130 billionaires (Forbes list)
• 330 politicians from 90 countries

The findings in the Pandora Papers investigation echo what we learned from the Panama Papers. But the Pandora Papers go further and tell us even more. The investigation implicates 330 politicians and 130 Forbes billionaires, in addition to celebrities, fraudsters, members of royal families, drug dealers, and religious leaders. It gathers information on more than 27,000 companies and 29,000 beneficial owners – over twice the number identified in the Panama Papers.
That the leaks came from 14 different firms and include documents in multiple languages is even more evidence of a complex global system of financial secrecy and tax evasion. This isn’t the work of a few bad actors, but a worldwide system to conceal wealth and assets. The result is more global inequality, increased distrust and discontent among populations around the world, and criminality and corruption going unseen and unpunished.
The Technology Stack

How do you make sense of 11.9 million documents, which include 10,000-page PDFs and years worth of emails, written in many different languages?
As I have noted in previous posts, the ICIJ is a modern organization that uses an open source stack consisting of their datashare platform, machine learning (ML) toolkits in Python, Neo4j, and Linkurious as graph visualization and analytics tooling. Thanks to these very powerful technology solutions, especially the Linkurious investigation platform, the ICIJ was able to unravel the stories in this massive leak in just over one year – a massive feat considering only 4% of the files were structured to begin with.
To quote briefly from the ICIJ report before we venture into the weeds:
Only 4% of the files were structured, with data organized in tables (spreadsheets, csv files, and a few “dbf files”).
… In cases where information came in spreadsheet form, the ICIJ removed duplicates and combined it into a master spreadsheet. For PDF or document files, the ICIJ used programming languages such as Python to automate data extraction and structuring as much as possible.
In more complex cases, the ICIJ used ML and other tools, including the Fonduer and Scikit-learn softwares, to identify and separate specific forms from longer documents.
… After structuring the data, the ICIJ used [graph] platforms (Neo4j and Linkurious) to generate visualizations and make them searchable. This allowed reporters to explore connections between people and companies across providers.
First, the ICIJ used two self-developed technologies in combination to comb through the documents. One, called Extract, is able to share the computational load of extracting information between multiple servers. When you have millions of documents, Extract is able to tell a server to look at one document and another server to look at another. Extract is part of a larger ICIJ project, called Datashare, which is a data structuring tool. Everyone has to use Datashare to explore the documents. They can download documents to their own machine, but they have to use Datashare to search the documents because it’s not doable to go through 11.9 million documents without the system.
Datashare was vital because just four per cent of the 11.9 million files the ICIJ received as part of the Pandora Papers were ‘structured’ – that is, organised in table-based file formats such as spreadsheets and CSV files. Those structured files are far easier to handle and interrogate. Emails, PDFs and Word documents are more difficult to search for data. Images, of which there were 2.9 million, are even more complicated to analyse computationally. Datashare parses all the documents, including scanning PDF files through optical character recognition (OCR) through Tesseract, an open-source system. Apache’s Tika Java framework was used to extract text from all the documents. Tika can handle 50 or more different documents. The data Tika extracts is then ultimately accessed through Datashare by the end user.
Without some kind of structure, the 600 partner journalists that the ICIJ worked with on the Pandora Papers would struggle to identify newsworthy nuggets of information contained within the millions of files they had access to. The first step is to get the data and make it searchable.
ICIJ removed duplicates via a specialized Python program that could dedupe across multiple servers simultaneously.
Second, the ICIJ had to identify the files containing beneficial ownership information and structure that data. They combined individual spreadsheets into master spreadsheets. For PDF or document files, ICIJ used programming languages like Python to automate data extraction and structuring where possible. For more complex cases, the ICIJ used machine learning and other tools like Fonduer and Scikit-learn softwares to identify and separate certain forms from longer documents.
Third, after filtering and structuring the data, the Linkurious Enterprise investigation platform and Neo4j graph database were able to help the journalists easily search, explore, and visualize this huge quantity of data. Linkurious Enterprise is built for this. It enables analysts and investigators to easily explore and visualize data through a network analysis approach to quickly understand all the complex direct and indirect connections within huge amounts of data. A longtime user of Linkurious through the Linkurious for Good program, the ICIJ also used the investigation platform for the Panama Papers, Paradise Papers, and FinCEN Files investigations.
With Linkurious, the journalists were able to collaboratively establish a precise picture of the tens of thousands of businesses and beneficial owners (UBOs) implicated in the leak. Through intuitive network visualizations, the journalists could explore and understand the connections between all of these entities across providers. They were also able to bring in external data sets, like sanctions lists, previous leaks, and public records, to help identify the most interesting stories and give extra context to the leaked data.
Some of the visualizations created for the investigation are available to the public on the ICIJ’s website.
As I have noted before, graph databases (such as Neo4j) excel at spotting data relationships at scale. Instead of breaking up data artificially, graph databases more closely mimic the way humans think about information. Once that data model is coded in a scalable architecture, a graph database is matchless at mining connections in huge and complex datasets.
And two other important notes:
1. Sorting and interrogating the data was much harder than the Panama or Paradise Papers. Although the datasets are of a similar size to those two leaks, the individual documents are significantly bigger in page count – around ten times bigger – than the Panama Papers. The system the ICIJ used until now to search into the documents was not powerful enough to handle such a massive amount of big documents. As a result, the ICIJ had to improve the configuration of its servers, and the way its search tools operated, to handle these new files. There were huge 10,000-page PDF files. They had to cut those PDF files into pages, gather those pages into logical forms, and then had to extract the data – like beneficial owners and their nationalities from unstructured data.
2.The Pandora Papers included a broader range of file types and formatting that the machine learning systems the ICIJ previously used had to learn about to be able to parse and identify in order to be able to sort. So it’s now able to read very specific financial documents and very specific PDFs.
Messing with the data

In a few weeks, the Pandora Papers data will be published and integrated into the Offshore Leaks database, which is also powered by Linkurious and Neo4j. Until then, you can jump on the ICIJ site and see what they’ve done to date.
The section of the site having the most clicks is “Power Players” – those illustrious figures that the ICIJ chose to highlight in a dedicated section of the investigation. You can read it here. It’s quite interactive. It explores the stories behind the use of offshore companies by high-profile politicians – more than 3,300 in all – or by their relatives or close associates. Among them are 35 current or former country leaders and other prominent politicians and public officials found to have direct connections to structures in tax havens.
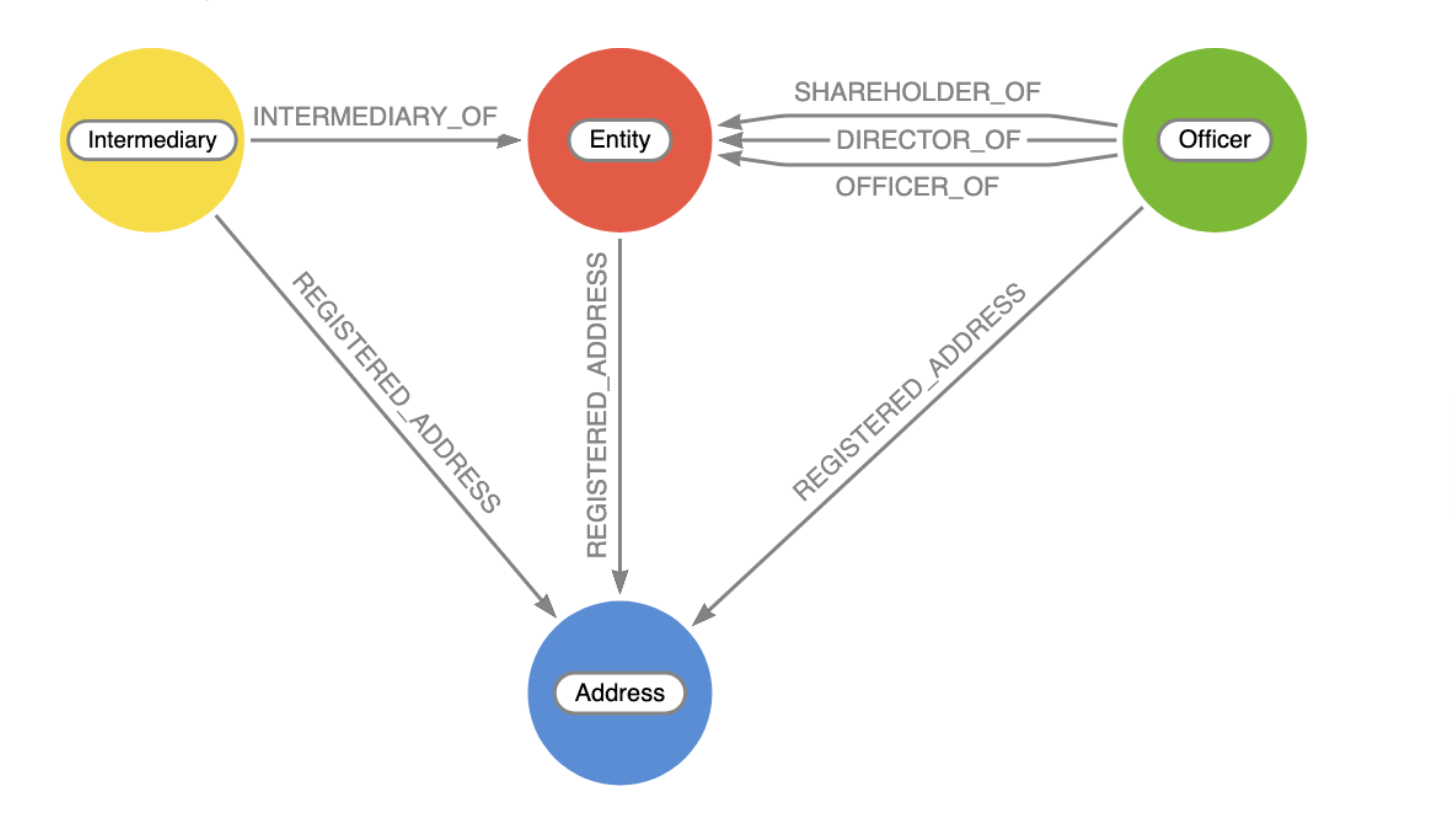
And as for data models, here is just one example of how you are able to put data into a Neo4j graph database instance to query and visualize. The data model for the ICIJ investigations looks a bit like this:

Where the elements are:
– Entity: shell company or offshore construct
– Intermediary: law firm or bank that helped create and manage the shell company
– Officer: proxy or real owners/shareholders/directors of a shell company
– Address: registered addresses for the entities above
In the current “Power Players” visualizations I noted above, only Officers and Entities are depicted so we have to wait for the remaining data to become available. But what ICIJ is doing is running it visually through Neo4j Bloom, which is easy, because you can both query with natural language in the search field as well as explore interactively and style and filter the data to your heart’s content.
The disruption in database analysis

Neo4j, which the ICIJ said was key to their ability to analyse the Pandora papers, recently raised the largest funding round in database history – $325 million. Full disclosure: I am a limited partner in one of the investor groups in that funding and I have followed Neo4j for a number of years.
There has been enormous growth and disruption in the database space. Over the next few years, a handful of companies will emerge as the new leaders in the database market, and I think they’ll have a pretty good run.
The following? Just a few words to put this market in context.
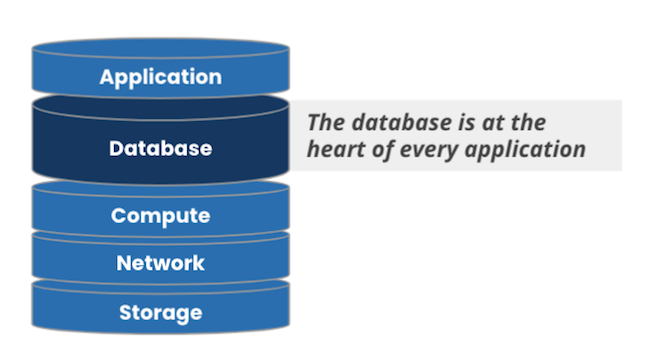
Everything we do in our daily digital lives – a text message, buying groceries online, a zoom call, or even driving a modern car – is centered around information. All of that information ultimately lands in a database. Databases are a fundamental part of the fabric of present-day tech society.

That’s why the database market is the largest market in all of enterprise software. Companies spent more than $50B last year on database software, a number that’s expected to grow to more than $100B by 2025. However, from an innovation perspective that market has been static. The relational database was invented in the late 1970s. And while Larry Ellison has bought many yachts and a few Hawaiian islands with the fruits of the commercial success of the relational database, the technology has remained remarkably the same.
But that changed in the early part of the previous decade. All of a sudden, this huge market was attacked from all fronts by a number of massive, secular trends – the shift to the cloud, sensor proliferation, big data, new patterns in architecture like microservices, and of course AI and machine learning. These trends converged into a perfect storm that gave birth to NoSQL and the rise of non-relational databases. Hundreds of database projects were born (DB-Engines is now tracking more than 350). Several dozen database startups were wrapped around some of those projects, founded by wide-eyed entrepreneurs hoping to reimagine the database for modern needs and funded by venture capitalists … with their sights set on a piece of Larry’s mansion.
After much debate, the industry converged on an understanding of non-relational and relational as complementary, and – more broadly – that the era of the one-size-fits-all database was over. In other words, the relational database isn’t going anywhere. But it’s no longer the only game in town.
This all brings us back to the present. As we’re walking into the 2020s, a few companies from the last decade have emerged as leaders. They’ve achieved commercial scale ($100m+ ARR). They’re growing fast. And they’re ushering in the next era of data management: the great unbundling of the database market. And graph is going to be a major player if not the major part of that landscape.
Why? It’s not been too long since graph databases were thought of as a valuable but niche part of the database market. But day by day, year by year, people are coming to the realization of just how broadly applicable graphs truly are. Consider the evidence:
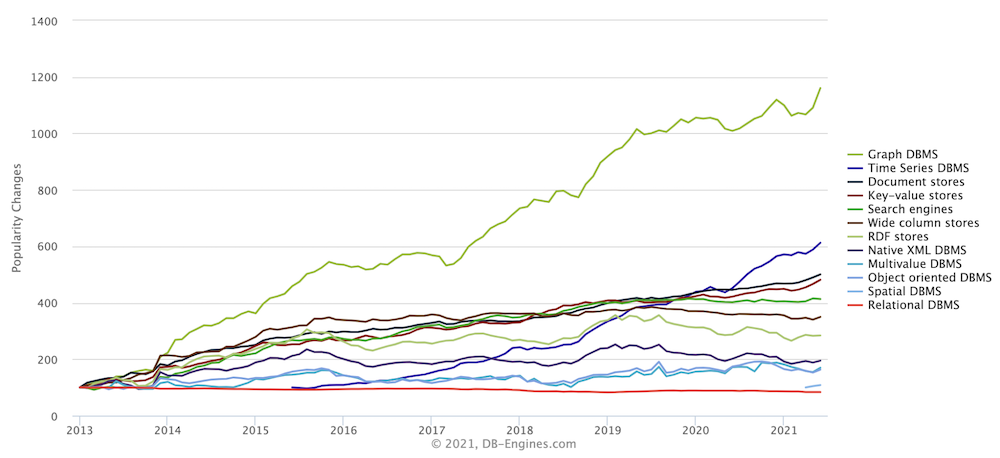
One. Grassroots adoption. If you look at real-world community adoption by developers and data scientists, graph databases have been the fastest-growing database category, by a mile, in the last decade. Developers love graph databases.

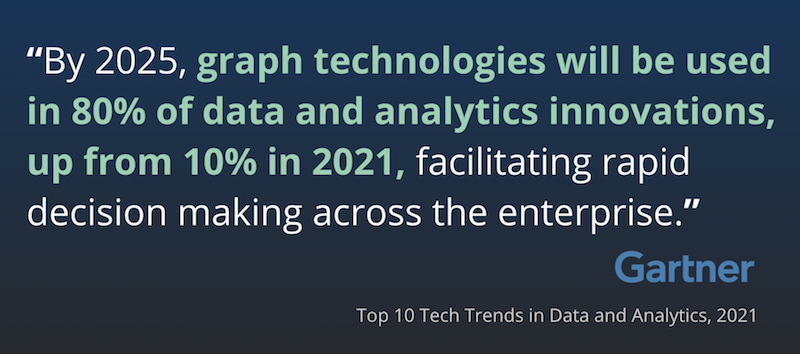
Two. Enterprise adoption. All of the 20 biggest banks in North America are now using Neo4j. Seven of the 10 biggest retailers. Four of the 5 biggest telcos, and almost all of the Fortune 100. And this trend has just begun. From Gartner’s Top 10 Tech Trends in Data Analytics (2021). The enterprise is going all in on graphs:
Three. Data scientists. Relationships have been proven to be a very strong predictor of behavior. Google shifted their machine learning over to graph-based machine learning several years ago. And the enterprise follows: In 2020, half of Gartner’s inquiries about machine learning and AI – half – were about graphs. Graph databases are now an essential tool not only for developers, but also increasingly for data scientists. This will be a huge driver of success for graph databases in this decade.
And, four. Ludicrous scale. For the longest time, there was this notion out there that graph databases do not scale. But as revealed in the recent leak of Facebook documents (read them: they are not all about teens, body shaming, misinformation and the murder of democracy), the tech is out there to run a live social network application with more people nodes than Facebook (3 billion people nodes compared to FB’s 2.7 billion), running against a trillion+ relationship graph, sharded across more than 1,000 servers, and executing deep, complex graph queries that return in less than 20 milliseconds.
So we’ve got the fastest-growing category in the largest market in enterprise software. A category that Gartner is claiming will be “the foundation of data and analytics.” A huge community of hundreds of thousands of developers and data scientists who are building applications and machine learning for every industry, every market. Yes, a market that after decades of stagnation is ripe for disruption (that word again). The great unbundling of the database market has begun.


One Reply to “A “tsunami of data”: the investigative technology and methodology behind “The Pandora Papers””