25 March 2020 (Brussels, Belgium) – A new analysis from the data science company Descartes Labs helps provide a window onto how the global coronavirus pandemic is forcing dramatic changes to daily life and energy use.
Why it matters: From an oil standpoint, the huge cutbacks in travel and economic activity have caused global oil demand to crater by millions of barrels per day.
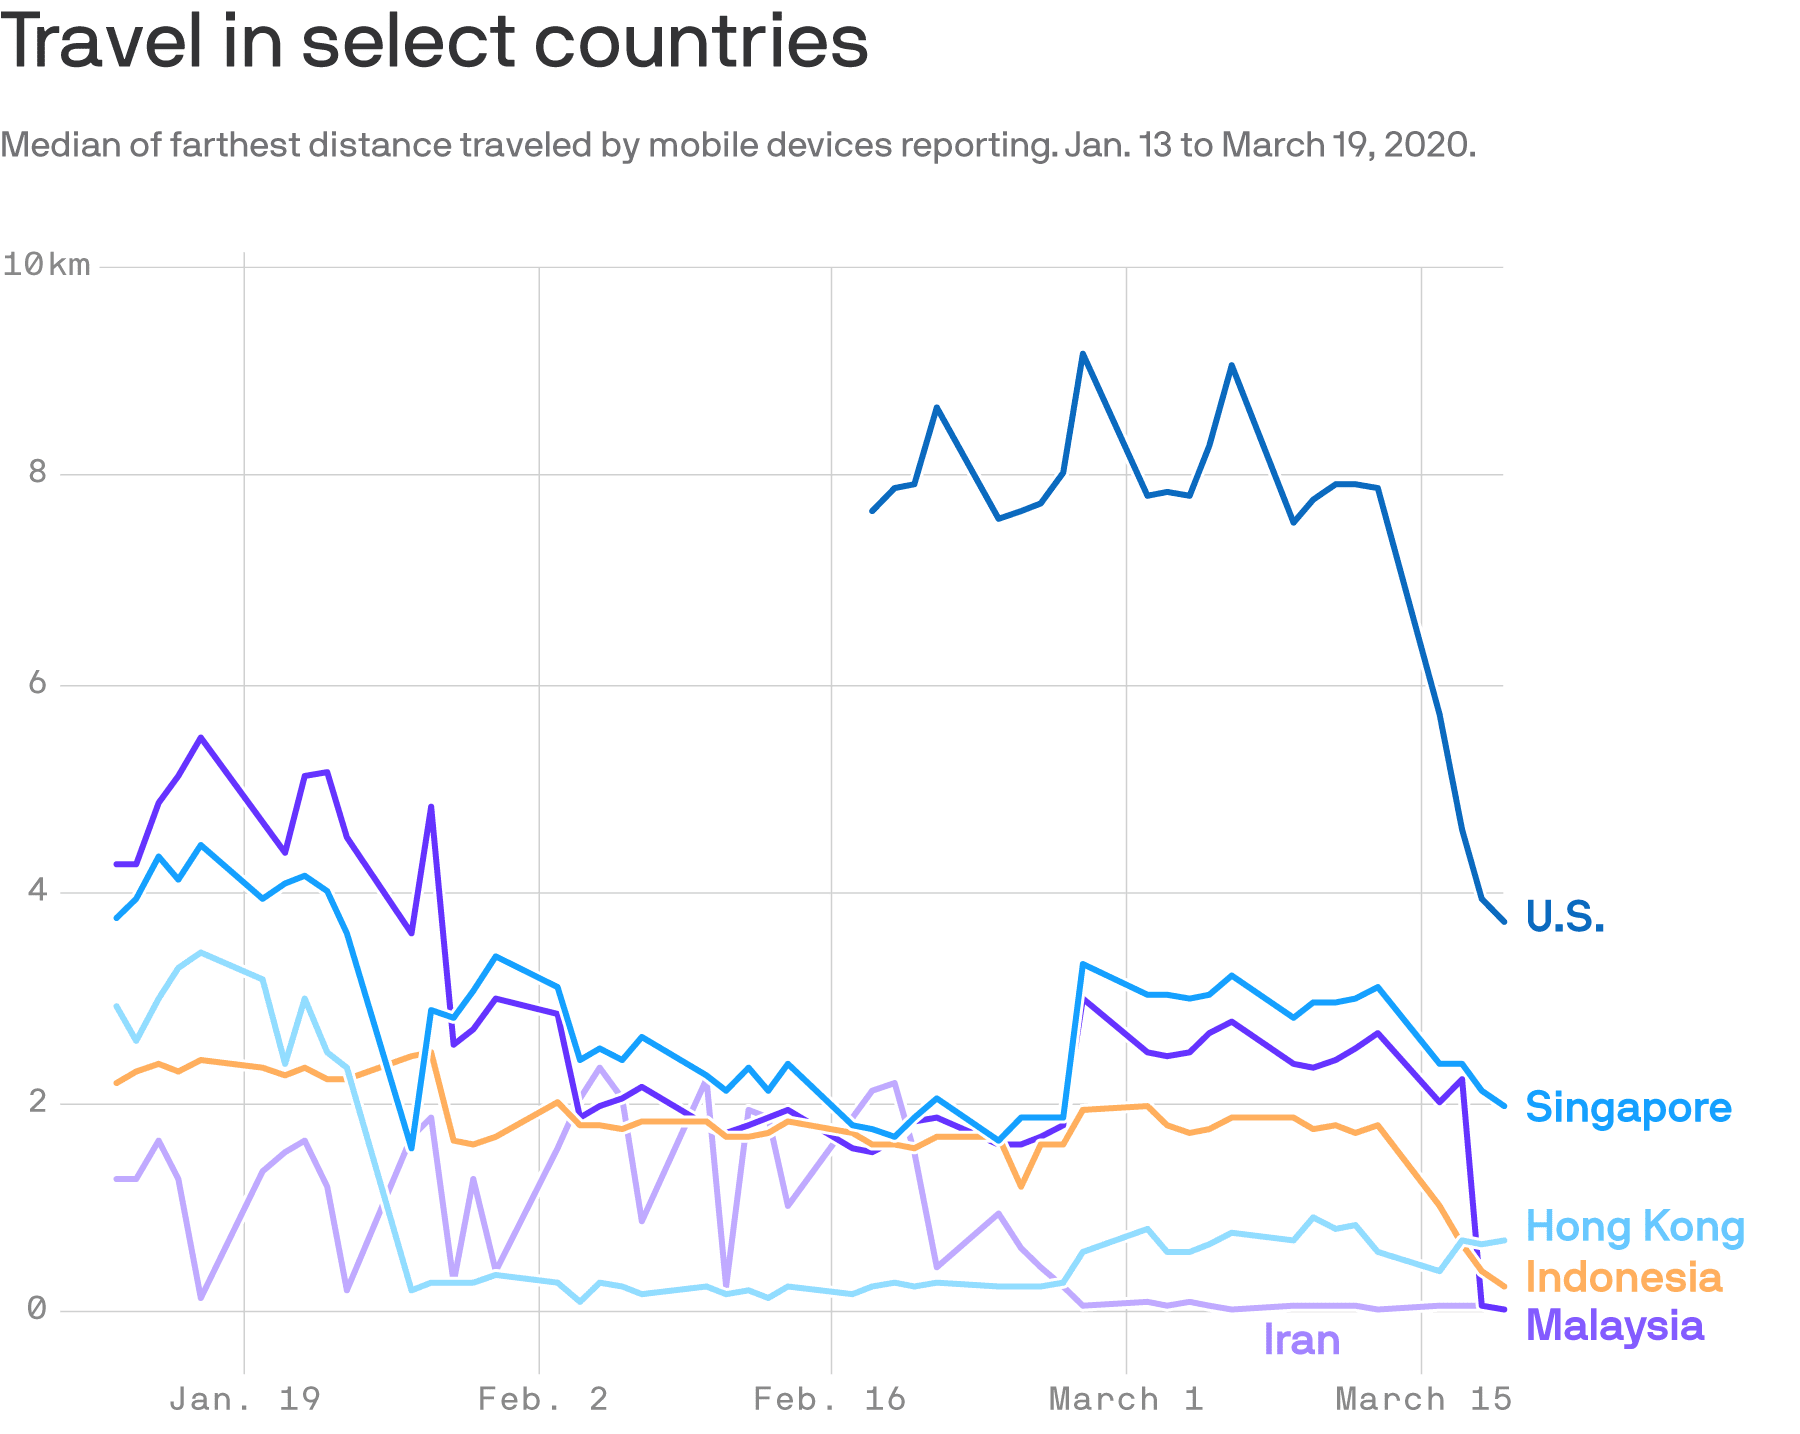
What they did: Analysts used a tracking tool that collected data from mobile devices reporting throughout the day, calculating the maximum distance moved from the first reported location.
• Check out the chart above, which reflects a mobility metric for each country based on the median distance across all devices in their sample.
What they found: The data for the U.S. shows how the steep drop in mobility didn’t begin until around March 14, “corresponding roughly with the start of widespread school closings and social distancing.”
The big picture: It’s part of a wider analysis published this week of changes in travel, pollution, supply chains and more.
• In a separate part of the tracking initiative, they looked at changes in device counts at different airports for March 9–13, relative to Feb. 10–14.
• “Airports on the West Coast, and California in particular, showed decreases of 50% or more. The decrease in device counts at most other airports ranged from 20% or 40%,” they note.
